Additional Explorer features
Display
Dark mode
Toggle between light and dark mode from the Explorer's Settings tab.
Table layout for response data
Toggle between table and JSON layout from the top of the Explorer's Response panel.
You can view an operation's response as JSON or as a table. Table layout is especially useful when your response includes an array, or when you want to share a query's results with someone who isn't familiar with JSON.
When looking at arrays of data in table mode, you can click the header of any column of data to sort your array by that column's values.
Inline/Extract fragments
Right-click any fragment name to inline that fragment in queries where it is used. Right-click any selection of fields to extract those fields into a fragment.
While editing your operations, you can now inline and extract your fragments with one click. This is useful when trying to select the same fields in multiple places using fragments, or when trying too inline fragments into a single operation to be used somewhere else.
Inline/Extract variables
Click the "..." menu next to an operation in the editor to select a notation for variables.
While editing your operations, you can toggle between inline or extracted notation for variables. This is useful when you want to switch notations to copy and paste something, or when you're drafting a query in the editor and want to move it to your code.
Inline variable
query {user(id: "Beth Harmon") {name}}
Extracted variable
query ($id: ID!) {user(id: $id) {name}}
{"id": "Beth Harmon"}
File upload
The Explorer supports file upload for servers that support the GraphQL multipart request spec. To run an operation that requires files as input, click + Add files in the Explorer's Variables tab:
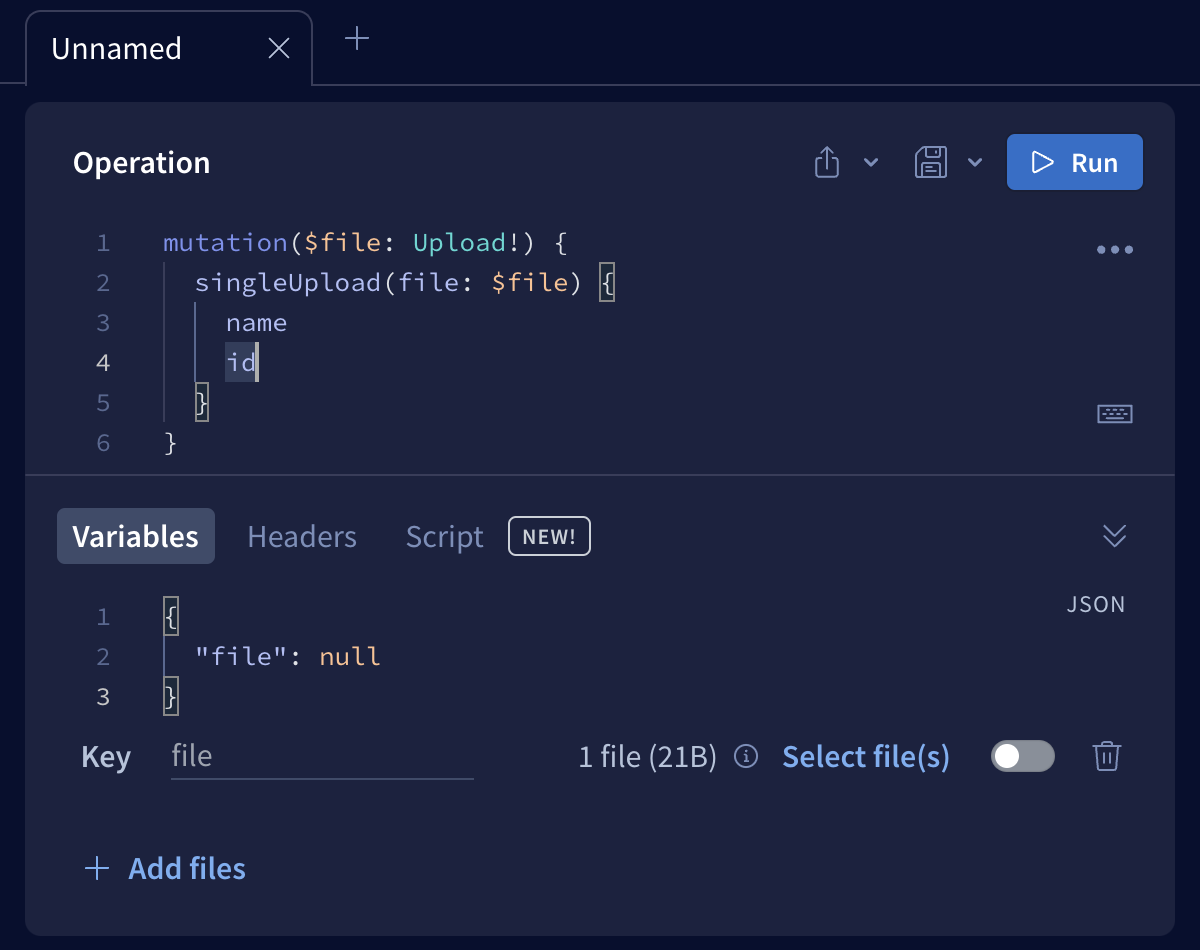
You can then set the name of the variable and select the files you want to upload. Note that if your operation supports providing multiple files via a single variable, you need to select the toggle for that variable to enable the multi-file protocol.
Local development
You can use the Explorer for local development by opening Sandbox.
Unlike a deployed graph, Sandbox uses introspection to fetch your schema from your development server, and it also polls regularly for changes. Whenever schema changes are detected, they're pulled in automatically.
You can pause introspection polling at any time. To do so, open the Explorer Settings tab on the left and edit your connection settings. In the dialog, disable Auto Update.
Supergraphs
Query plans for supergraphs
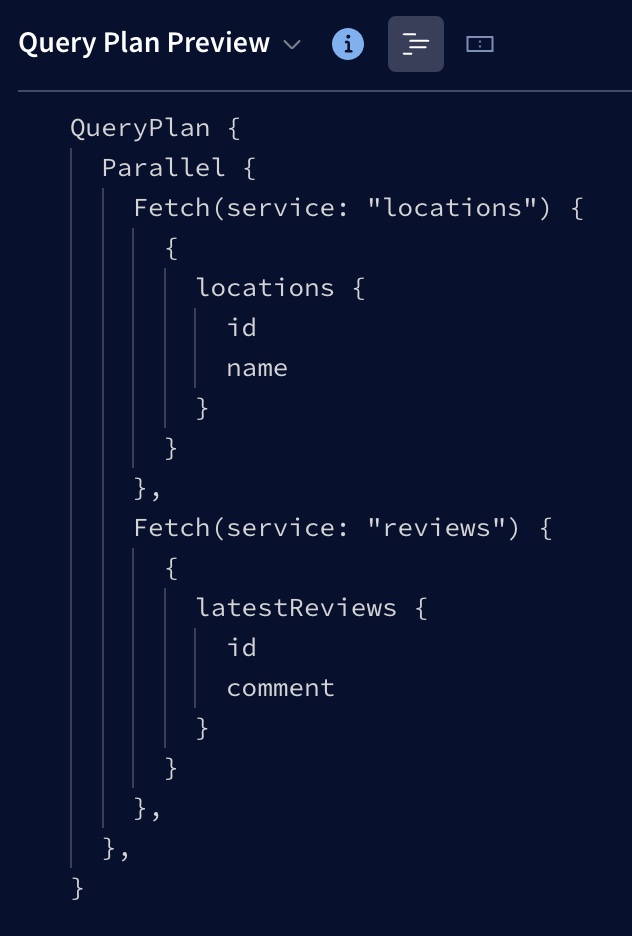
If you're working with a supergraph in Studio, the Explorer dynamically calculates example query plans for your operations in the right-hand panel (click Response and select Query Plan Preview from the dropdown):
If you don't see the Query Plan Preview option, make sure you're using the full version of the Explorer, not Apollo Sandbox. Also make sure you're using the Explorer with a supergraph.
As you edit an operation, the Explorer recalculates its example query plan accordingly.
⚠️ The Explorer might not use the exact same query planning logic as your router! The example query plan helps you reason about your operations, but it is not intended as a source of truth.
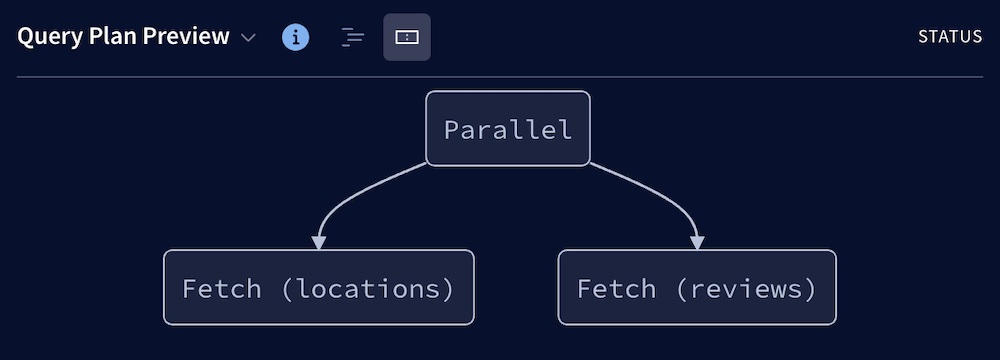
There are two display modes for query plans. You can switch between Show plan as text and Show plan as chart by clicking the icons next to Query Plan Preview:
Subscription support
Note that supergraphs do not currently support subscription operations. You can only execute subscriptions in the Explorer with a monograph.
The Explorer supports the following libraries/protocols for sending subscription operations over WebSocket:
graphql-ws- This library uses the
graphql-transport-wsprotocol.
- This library uses the
subscriptions-transport-ws- This library uses the
graphql-wsprotocol (not to be confused with thegraphql-wslibrary above). - Most Apollo Server instances with subscriptions enabled use this library.
- This library uses the
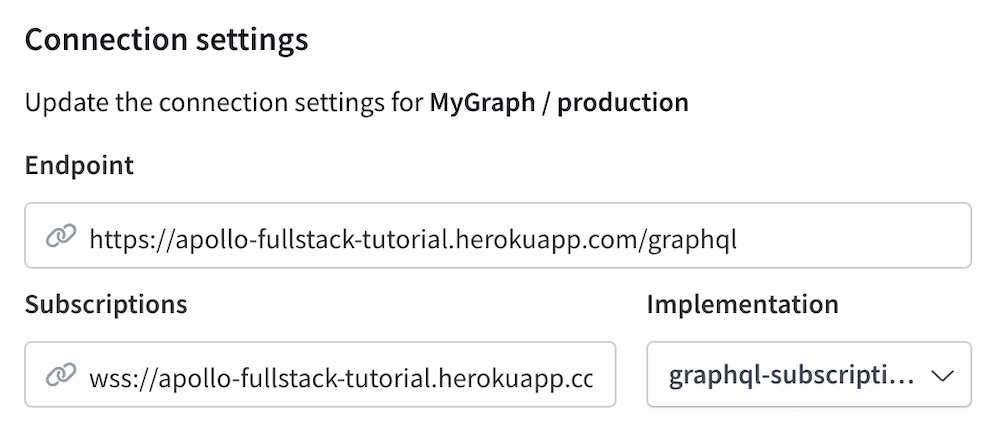
To execute a subscription operation, first specify your subscriptions endpoint and implementation in the Explorer's connection settings:
When you execute a subscription, a Subscriptions panel appears in the bottom-right of the Response panel:
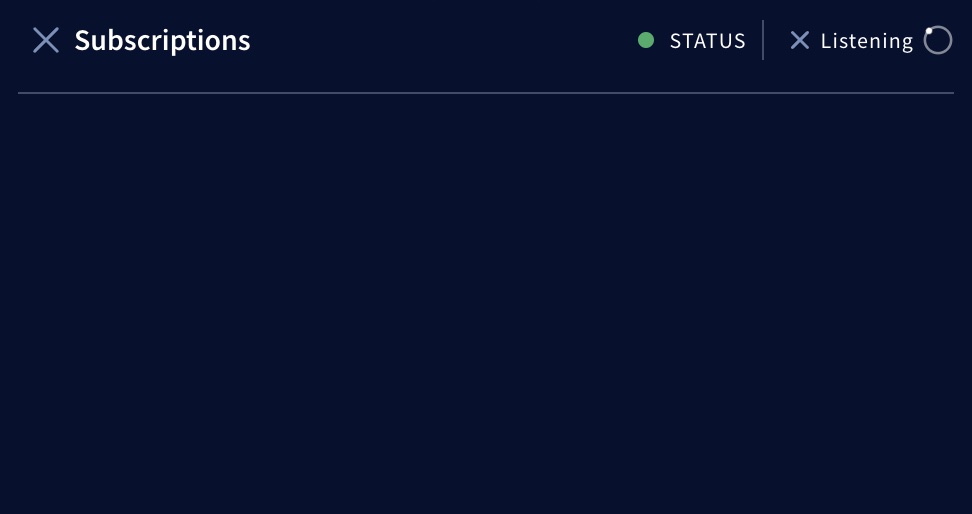
The dot next to STATUS indicates whether the Explorer is connected to your WebSocket endpoint (green if connected, red if disconnected). As long as you're connected and listening for updates, any such updates appear in the panel as they're received.
If you can't connect, double-check that you've specified the correct subscriptions endpoint and implementation.
You can click the X next to Listening to stop listening for updates (the updates you've already received remain in the panel). You can also click the X next to Subscriptions to close the panel entirely.
Embedding
If you've enabled public access to a variant of your graph, you can embed the Explorer in a webpage that you can then provide to your graph's consumers. This enables those consumers to test out operations from your own website.
Saving operations
Operation history
View your operation history from the Explorer's Run history tab.
The Explorer saves the history of your recently run operations (and the variable values for those operations) to your browser's local storage. Access your history to retain and recover previous work without cluttering your editor.
Downloading responses
You can copy responses from your operations with a button or download any given response to a local JSON file.
If you are looking at your data in the table layout, you will also be able to download arrays in your response to CSV files.
Testing operations
Tracing
Enable Inlined traces from the Explorer's Settings tab.
If you're using Apollo Server, you can see traces from your responses inlined in the Explorer by adding the ApolloServerPluginInlineTrace plugin to your server's configuration:
import {ApolloServerPluginInlineTrace} from '@apollo/server/plugin/inlineTrace';const server = new ApolloServer({typeDefs,resolvers,plugins: [ApolloServerPluginInlineTrace()]});
Turning on the inlined traces feature in the Explorer's settings tells the Explorer to forward a special header to your server to request that it return tracing information along with its response.
Mocked responses
Enable Mock responses from the Explorer's Settings tab.
This feature naively mocks operation responses based on your schema's types, instead of sending your operations over the wire to your endpoint.
Mocked responses are helpful if you want to get a feel for the shape of a query's response when your endpoint isn't available, or if you need a quick response to use in a code sample or a unit test.
Response hints
Enable Use response hints from the Explorer's Settings tab.
As you build your query, the Explorer runs partial queries under the hood and shows their results in-line. This is helpful when you want to get a sense of the data you'll get back in your full operation response. It can also help you retrieve a quick answer to a query without needing to click the Run button.
The Explorer does not show response hints for mutations (this requires running partial mutations, which is unsafe).
Default headers
Set Default Headers from the Explorer's Settings tab.
WARNING: Do not use default headers to provide sensitive information, such as an access token. Instead, use environment variables
You can specify default headers that are applied to every Explorer request executed by every user in your organization. This can be useful if you want to provide a consistent identifier to your server for requests coming from the Explorer.
Field latency hints
As an alternative to response hints, the Explorer can show you hints for the latency of the fields in your query. This option is available only if you've configured your graph to report field usage and tracing data to Studio.
The Explorer shows you the 95th-percentile (default) response times for the fields in your query to help you get a sense of how "expensive" your query is and what the bottlenecks in response time will be. You can change which percentile you want to see hints from at any time in the Explorer settings.
graphql-lodash integration
The Explorer extends your schema with graphql-lodash on the client side, so you can write queries that include lodash directives and they will resolve correctly. This is helfpul if you want to manipulate your response data into into a specific format for exporting, or if you want to do some quick analysis without needing to export.
Here's an example of a query that uses graphql-lodash. You can try pasting this in the Explorer embedded at http://apollographql.com/studio/develop:
query StarWarsGenderStats {genderStats: allPeople @_(get: "edges") {edges @_(countBy: "node.gender") {node {gender}}}}
FAQ
Is the Explorer available for on-prem distribution?
The Explorer is not currently available for download or on-prem hosting. However, you can embed the Apollo-hosted Explorer on your own internal websites. For details, see Embedding the Explorer.
Do my Explorer operations pass through Apollo systems?
No. Operations you run in the Explorer are sent directly from your browser to your GraphQL endpoint, without passing through any Apollo systems along the way. Apollo never sees your request headers or response data. For more information, see Apollo Studio data privacy and compliance.