Measuring field usage in Apollo Studio
Understand which fields your clients use
For details on setting up field metrics reporting to Apollo Studio, see Reporting field usage.
In Apollo Studio, your graph's Fields page can display a table of basic usage metrics for each field in your schema:
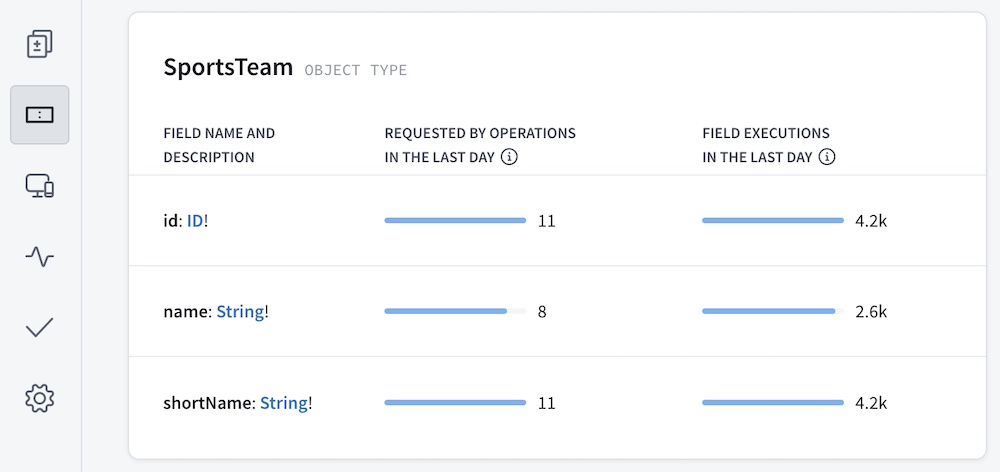
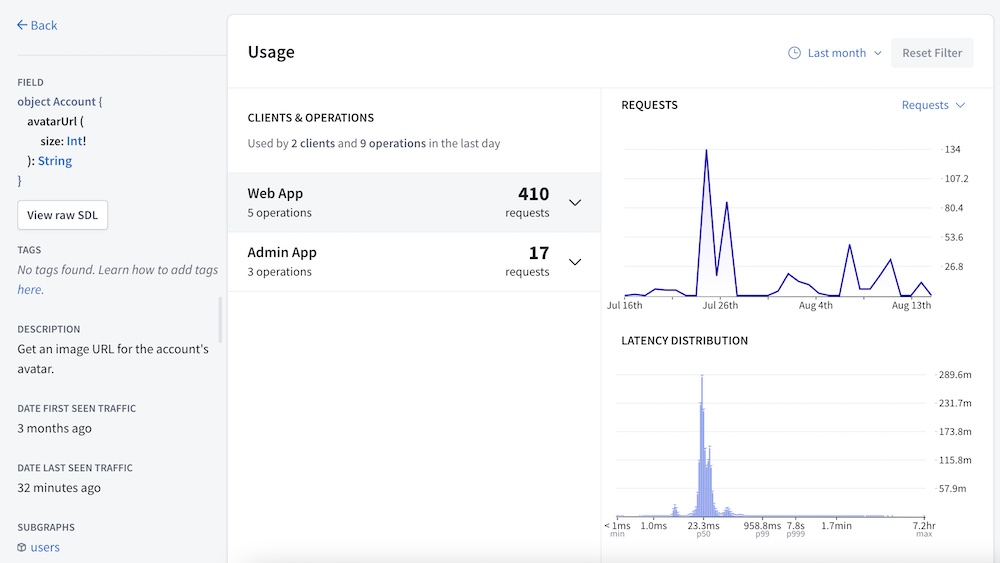
You can click the name of any field in the table to open its Field Insights page. This page displays in-depth details about which clients and operations contribute to the field's usage, along with performance metrics:
Field executions vs. requesting operations
The table on the Fields page displays some combination of the following metrics for each field, depending on which data your graph reports to Studio:
| Metric | Description |
|---|---|
| Field executions | How many times your servers have executed the resolver for the field over a given time period. |
| Requested by operations | How many operations sent by clients over a given time period have included the field, according to metrics provided by your servers. |
For each of these columns to appear on the Fields page, your GraphQL servers must report the associated metrics to Apollo Studio. If some but not all of your GraphQL servers report this data, the Fields page presents an incomplete picture of your graph's field usage.
Let's look at these two metrics for fields of an example type:
As you can see, the daily field executions and requesting operations for a single field can differ significantly! There are many possible reasons for this, described below.
Objects in lists
Let's say a client executes the following query one time:
query GetBooks {books {title}}
If Query.books returns a list of ten Book objects, then Book.title is resolved ten times. This query therefore contributes ten field executions and just one requesting operation to Book.title.
Multiple references to a field
Let's say a client executes the following query one time:
graphqlquery GetTwoBooks {firstBook: book(id: "123") {title}secondBook: book(id: "345") {title}}
This operation includes two references to the fields Query.book and Book.title. Therefore, the resolvers for these fields each execute twice (assuming Query.book doesn't return null). However, these multiple references are all part of a single operation.
Therefore, this query contributes two field executions and just one requesting operation to each of Query.book and Book.title.
Fields that return interfaces
Let's say our GraphQL server's schema defines the following interface and object types:
interface Media {title: String!}type Book implements Media {title: String!author: String!}type Query {favoriteMedia: Media!}
Now, let's say a client executes the following query:
query GetFavoriteMedia {favoriteMedia {title}}
If Query.favoriteMedia returns a Book object here, then Book.title is resolved one time. However, the original query does not reference Book.title. Instead, it references Media.title, because Query.favoriteMedia has a return type of Media.
Therefore, this query contributes one field execution and zero requesting operations to Book.title. It also contributes one requesting operation to Media.title. Note that interface fields always have zero field executions.
Requested fields that aren't resolved
Let's say a client executes the following query one time:
query GetLoggedInUser {loggedInUser {name}}
Now, let's say Query.loggedInUser returns null because no user is logged in. In this case, the resolver for User.name never executes, because its parent retuns null. Therefore, this query contributes zero field executions and one requesting operation to User.name.
A requested field might not be resolved for any of these reasons:
- The field is nested under a field that returns
null, as shown above. - The field is nested under a field that returns a list, but the list is empty.
- The field is part of a fragment that doesn't apply to a particular object.
- The resolver is skipped due to a
@skipor@includedirective.
@key and @requires fields in a federated graph
This case applies only to graphs that use Apollo Federation.
Let's say our federated graph includes these two subgraph schemas:
# Products subgraphtype Product @key(fields: "id") {id: ID!name: String!}
# Reviews subgraphextend type Product @key(fields: "id") {id: ID! @external}type Review {id: ID!score: Int!product: Product!}type Query {reviews: [Review!]!}
Now, let's say a client executes the following query against the gateway:
query GetAllReviews {reviews {scoreproduct {name}}}
This query's execution starts in the Reviews subgraph, but it needs to obtain each Product's name from the Products subgraph. As part of this process, the Products subgraph must resolve references to Products that are provided by the Reviews subgraph.
To help resolve these references, the Reviews subgraph must return each Product's id field, even though that field isn't included in the original query. This is because id is a @key field for Product.
Therefore, this query contributes one field execution and zero requesting operations to Product.id. Similar logic applies to fields that use the @requires directive.
Reporting field usage
Your GraphQL server can report metrics for field executions, requesting operations, or both.
Prerequisites
⚠️ Before continuing, make sure you've configured your Apollo Gateway or individual GraphQL server to push metrics to GraphOS.
To report each type of field usage metric to Apollo, make sure your graph meets the prerequisites for that metric:
Requesting operations
To report metrics for requesting operations, your GraphQL server must run Apollo Server 3.6 or later.
If you have a federated graph, your gateway must run Apollo Server 3.6 or later, but there are no requirements for your subgraphs.
Field executions
To report metrics for field executions, your GraphQL server can run any recent version of Apollo Server 2.x or 3.x.
If you have a federated graph, your subgraphs must support federated tracing. For compatible libraries, see the FEDERATED TRACING entry for libraries in this table.
If some of your subgraphs support federated tracing and others don't, only field executions in compatible subgraphs are reported to Apollo.
Reporting with a supergraph
If you have a self-hosted supergraph, you only need to configure your router to send metrics to GraphOS. Subgraphs should not send any metrics to GraphOS directly. Instead, they can include trace data in their responses to the router. The router then includes that data in its own reports to GraphOS.
Performance considerations
Calculating field execution metrics can affect performance for large queries or high-traffic graphs. This is especially true for federated graphs, because a subgraph includes each operation's full trace data in its response to the gateway.
Disabling field execution metrics
In Apollo Server 3.6 and later, you can disable field-level instrumentation for some or all operations by providing the fieldLevelInstrumentation option to ApolloServerPluginUsageReporting.
Disabling field-level instrumentation for a particular request has the following effects:
- The request does not contribute to the "field executions" statistic on the Fields page in Studio.
- The request does not contribute to field-level execution timing hints that can be displayed in the Explorer and in VS Code.
- The request does not produce a trace that can be viewed in the Traces section of the Operations page in Studio.
These requests do still contribute to most features of Studio, such as schema checks, the Operations page, and the "requesting operations" statistic on the Fields page.
To disable field-level instrumentation for all requests, pass () => false as the fieldLevelInstrumentation option:
new ApolloServer({plugins: [ApolloServerPluginUsageReporting({fieldLevelInstrumentation: () => false})]// ...});
If you do this, field execution statistics do not appear on the Fields page.
Fractional sampling
You can enable field-level instrumentation for a fixed fraction of all requests by passing a number between 0 and 1 as the fieldLevelInstrumentation option:
new ApolloServer({plugins: [ApolloServerPluginUsageReporting({fieldLevelInstrumentation: 0.01})]// ...});
If you do so, Apollo Server randomly chooses to enable field-level instrumentation for each request according to the given probability.
⚠️ Make sure to pass a number (like 0.01), not a function that always returns the same number (like () => 0.01), which has a different effect.
In this case, whenever field-level instrumentation is enabled for a particular request, Apollo Server reports it to Studio with a weight based on the given probability. The "field executions" statistic on the Fields page (along with execution timing hints) is scaled by this weight.
For example, if you pass 0.01, your server enables field-level execution for approximately 1% of requests, and every observed field execution is counted as 100 field executions on the Fields page. (The actual observed execution count is available in a tooltip in the table.)
Custom sampling
You can decide whether to enable field-level instrumentation (and what the weight should be) on a per-operation basis by passing a function as the value of fieldLevelInstrumentation.
For example, you might want to enable field-level instrumentation more often for rare operations and less often for common operations. For details, see the usage reporting plugin docs.