Daily reports from Apollo Studio
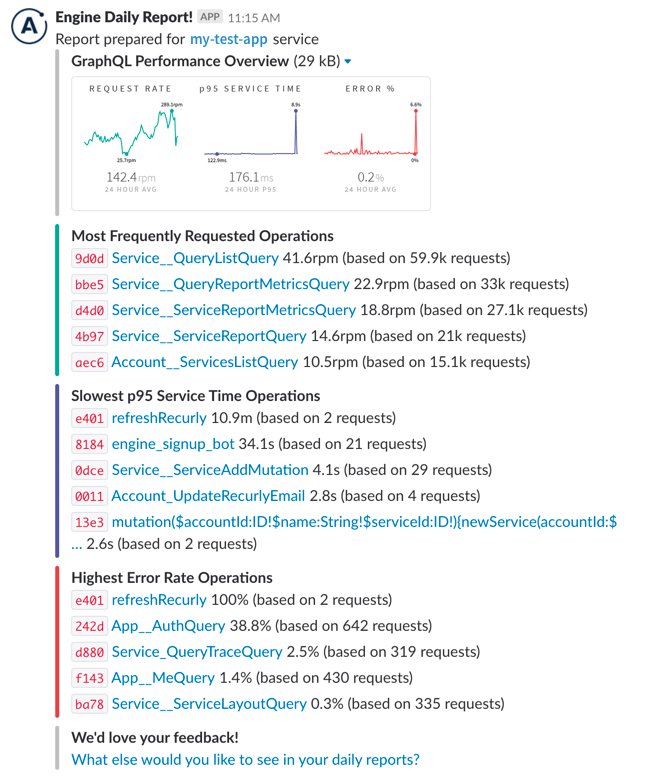
You can configure Apollo Studio to send your team a daily summary of your graph's activity over the last 24 hours:
When you configure daily reports, you can specify what time you want to receive them each day.
Setup
See Setting up Studio Notifications.
Acting on report data
The daily report provides an actionable summary of what's happened in your API over the last 24 hours. Here’s how you can use it to identify issues:
- Request rate: This shows you how many queries are hitting your server every minute, along with a list of the most popular operations. If you see a significant dip in this value, it might mean that queries aren’t able to reach your server, or that a particular client is down.
- p95 service time: An operation's p95 response time indicates that 95% of that operation's executions complete faster than the reported value. You can use this to identify that your API is overloaded and users are seeing long loading delays, or to find out which queries are taking the longest to run. This is often connected to UI performance, so a 500ms query probably means some part of your UI is taking that long to display.
- Error percentage: This shows you how many of your GraphQL requests produce an error result, along with a list of the operations with the highest error percentage. Spikes in errors might be the result of an underlying back-end malfunction.